SWP Calculator - Systematic Withdrawal Plan Calculator
A Systematic Withdrawal Plan (SWP) calculator helps investors estimate how much periodic cash they can withdraw from a mutual fund corpus while keeping the remaining corpus invested to earn market-linked returns. This guide explains how an SWP calculator works, how to use it step-by-step, and shows a worked example so you can visualise monthly flows, opening balance, returns earned, withdrawals and ending balance. You will also get practical comparisons between monthly, quarterly, half-yearly and yearly SWPs, a comparison of SWP with Senior Citizen Savings Scheme (SCSS) and Fixed Deposits (FDs), guidance on safe withdrawal rates used commonly in retirement planning, and a brief on taxation for mutual fund withdrawals in 2026. Understanding these points matters because the withdrawal frequency and rate determine both the regular income you receive and the longevity of your retirement corpus. A calculator removes guesswork by projecting how returns and withdrawals interact month-by-month, helping you choose a withdrawal rate aligned with your risk tolerance, other income sources and inflation expectations. This is especially relevant for retirees and anyone planning regular cash flows from investments: an SWP can smooth income while keeping money invested, potentially offering inflation protection compared with fixed-income alternatives.
How Does the SWP Calculator Work?
An SWP calculator models the interaction between your starting corpus, the periodic withdrawal amount, and expected returns. For each withdrawal period the calculator starts with an opening balance, applies the return for that period (based on an annual expected return and compounding frequency), subtracts the withdrawal, and produces a closing balance which becomes the next period's opening balance.
Because returns are applied before or after withdrawals depending on the convention used by the calculator, the precise monthly figures will differ slightly across tools. The essential purpose remains the same: show whether a chosen withdrawal amount is sustainable over your intended duration, and how the corpus evolves over time.
Practically, this helps you answer key questions: will the corpus last for the chosen duration at your withdrawal amount and assumed returns; how much of each withdrawal is coming from returns versus principal; and how sensitive the corpus is to changes in return assumptions or withdrawal frequency.
How To Use the SWP Calculator?
Choose monthly, quarterly, half-yearly or yearly withdrawals based on how often you need cash flow.
Provide your starting corpus, the total fund value from which withdrawals will be made.
Specify how much you want to withdraw each period; the calculator will test sustainability of this amount.
Enter a realistic expected return; the calculator uses it along with the compounding frequency to compute period returns.
Provide the number of periods (months/years) you want the SWP to run so the tool can project balances across the full timespan.
Example of SWP Calculator
| Month | Starting Balance | Monthly Withdrawal | Returns Earned | Ending Balance |
|---|---|---|---|---|
| 1 | 25,00,000 | 15,000 | 14,135 | 24,99,135 |
| 2 | 24,99,135 | 15,000 | 14,130 | 24,98,266 |
| 3 | 24,98,266 | 15,000 | 14,126 | 24,97,391 |
| 4 | 24,97,391 | 15,000 | 14,121 | 24,96,512 |
| 5 | 24,96,512 | 15,000 | 14,116 | 24,95,628 |
| 6 | 24,95,628 | 15,000 | 14,111 | 24,94,738 |
| 7 | 24,94,738 | 15,000 | 14,106 | 24,93,844 |
| 8 | 24,93,844 | 15,000 | 14,101 | 24,92,944 |
| 9 | 24,92,944 | 15,000 | 14,095 | 24,92,040 |
| 10 | 24,92,040 | 15,000 | 14,090 | 24,91,130 |
| 11 | 24,91,130 | 15,000 | 14,085 | 24,90,216 |
| 12 | 24,90,216 | 15,000 | 14,080 | 24,89,296 |
Difference Between Monthly, Quarterly, Half-Yearly, and Yearly SWP's
| Feature | Monthly SWP | Quarterly SWP | Half-Yearly SWP | Yearly SWP |
|---|---|---|---|---|
| Withdrawal Frequency | Every month | Every 3 months | Every 6 months | Once a year |
| Cash Flow Regularity | Highest | Moderate | Lower | Lowest |
| Best Suitable For | Regular monthly income | Periodic expenses | Planned withdrawals | Annual cash needs |
| Investment Growth Potential | Lower | Moderate | Higher | Highest |
| Withdrawal Amount | Small installments | Medium installments | Larger installments | Lump-sum withdrawal |
| Example | ₹10,000/month | ₹30,000/quarter | ₹60,000/6 months | ₹1,20,000/year |
SWP vs SCSS vs FD
| Feature | SWP | Senior Citizen Savings Scheme (SCSS) | Fixed Deposit (FD) |
|---|---|---|---|
| Type | Market-linked (Mutual Funds) | Government-backed | Bank deposit |
| Returns | Market-based (variable) | Fixed | Fixed |
| Risk | Moderate | Very Low | Very Low |
| Income Frequency | Flexible (monthly/quarterly/custom) | Quarterly | Monthly/quarterly |
| Capital Safety | Not guaranteed | Fully safe | Fully safe |
| Lock-in | No lock-in | 5 years | Flexible (depends on tenure) |
| Liquidity | High | Limited | Medium (penalty on early withdrawal) |
| Taxation | Capital gains tax (efficient) | Fully taxable | Fully taxable |
| Eligibility | Anyone | 60+ only | Anyone |
| Inflation Protection | Yes | No | No |
| Best For | Wealth + flexible income | Safe retirement income | Stable fixed income |
Safe SWP Withdrawal Rates in India
| Withdrawal Rate | Sustainability | Risk |
|---|---|---|
| 3% | Very High | Very Low |
| 4% | High | Low |
| 5% | Moderate to High | Moderate |
| 6% | Moderate | Moderately High |
| 7% | Low | High |
| 8% or more | Very Low | Very High |
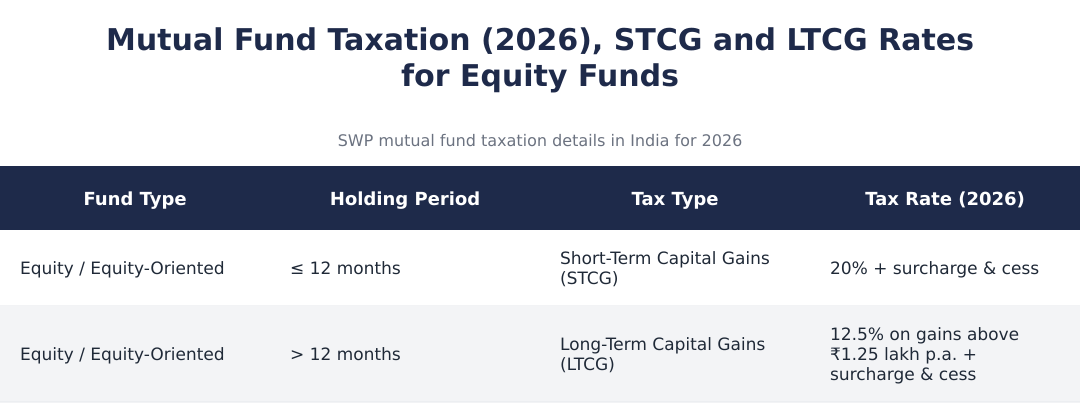
Systematic Withdrawal Plan (SWP) Taxation in India 2026
| Fund Type | Holding Period | Tax Type | Tax Rate (2026) |
|---|---|---|---|
| Equity / Equity-Oriented | ≤ 12 months | Short-Term Capital Gains (STCG) | 20% + surcharge & cess |
| Equity / Equity-Oriented | > 12 months | Long-Term Capital Gains (LTCG) | 12.5% on gains above ₹1.25 lakh p.a. + surcharge & cess |
How Does a SWP Calculator Help for Retirement?
A calculator turns abstract planning into concrete numbers: it shows how long your retirement corpus may last under a given withdrawal amount and expected return. That helps you choose a withdrawal rate compatible with longevity goals and other income sources such as pensions or annuities.
By showing the split between returns and principal in each withdrawal, the tool clarifies how much of your income is sustainable versus how much is eroding capital. This is useful for mid-course corrections, you can reduce or pause withdrawals if the corpus falls faster than expected, or increase them if markets outperform assumptions.
Because SWPs let remaining investments keep earning market returns, they can provide some inflation protection compared with locking everything into fixed-interest products. The calculator lets you test scenarios and adjust inputs (withdrawal amount, returns, frequency) to see their effect on corpus longevity.
An SWP calculator is a practical planning aid, it quantifies how periodic withdrawals, expected returns and frequency interact to determine corpus longevity and the mix of principal and returns in each payout. Use realistic return assumptions, pick a withdrawal rate mindful of the sustainability guidance above, and revisit projections periodically. For retirees, combining SWPs with other income sources and understanding the tax treatment of mutual fund withdrawals (STCG/LTCG rules) will help you design a stable and tax-efficient cash flow strategy.
Frequently asked questions
What does an SWP calculator do?
An SWP calculator estimates how much you can withdraw periodically from a mutual fund and shows the remaining corpus and returns over time. It takes your starting balance (corpus), withdrawal amount or desired income, expected annual rate of return, and withdrawal frequency to project opening balance, growth earned, withdrawal, and closing balance for each period. The calculator can output monthly, quarterly, half-yearly or yearly schedules and helps simulate examples, e.g., a ₹25,00,000 corpus with ₹15,000 monthly withdrawals shows monthly returns and ending balances for 12 months. This lets you test sustainability of withdrawals and compare scenarios before you set up the actual Systematic Withdrawal Plan (SWP).
How do I use an SWP calculator?
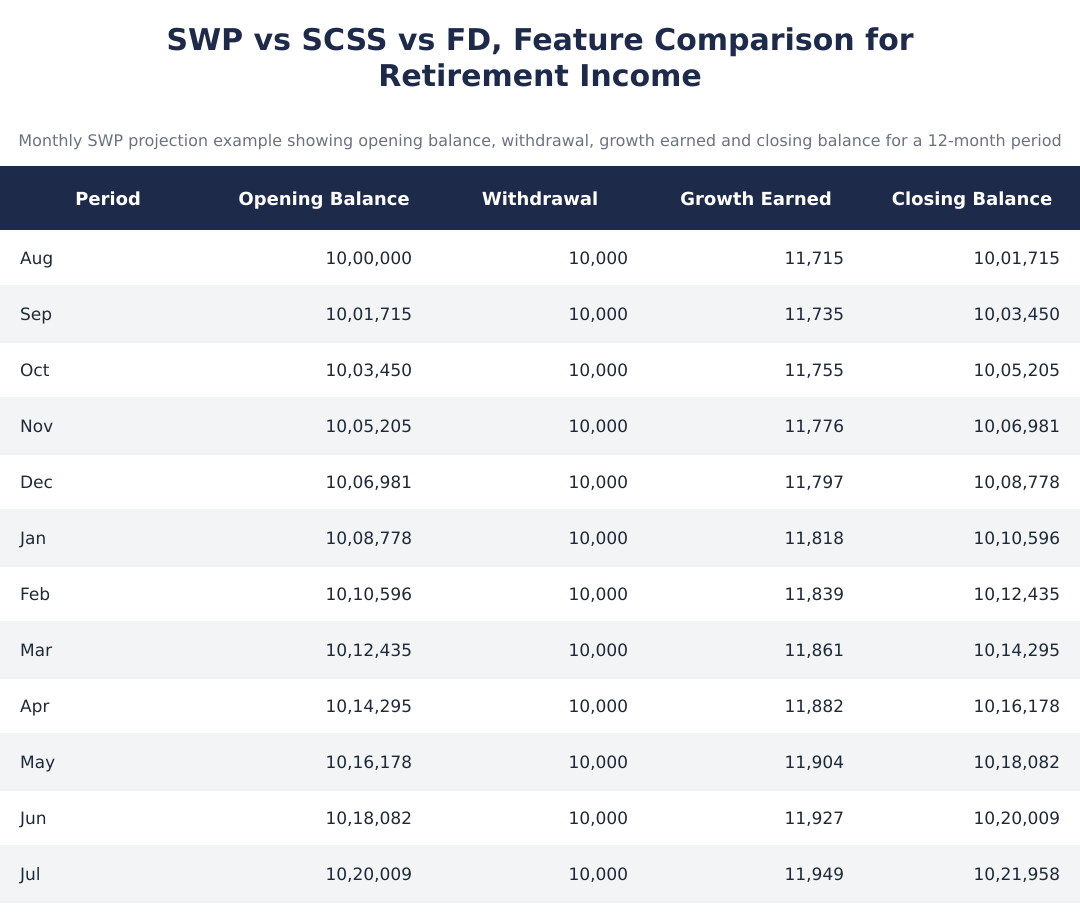
Use an SWP calculator by entering your starting corpus, the withdrawal amount (monthly/quarterly/annual), the expected annual rate of return, and the withdrawal frequency; the tool then projects period-wise opening balance, returns earned, withdrawal, and closing balance. For example, enter ₹10,00,000 corpus, ₹10,000 monthly withdrawal and a return assumption to see a 12-month table with opening balances, growth earned and closing balances. You can run multiple scenarios (different return rates or withdrawal sizes) to compare how fast the corpus depletes or grows. Many calculators also let you choose compounding periods (monthly/quarterly) to match how returns are credited in the fund.
Can you give an example of how an SWP works month by month?
Yes, for instance, starting with ₹10,00,000 and withdrawing ₹10,000 monthly while earning positive monthly returns, the opening balance grows slightly each month despite withdrawals: Aug opening ₹10,00,000 gives growth ₹11,715 and closing ₹10,01,715, and after 12 months the closing balance increases to about ₹11,69,362 in the sample table. The example tables show each month’s opening balance, withdrawal, growth earned and closing balance so you can see how returns offset withdrawals. That same format is used for longer horizons and different withdrawal sizes to illustrate whether the corpus depletes or keeps growing.
What are the benefits of using an SWP calculator?
An SWP calculator helps you plan sustainable withdrawals, visualise cashflow timing, and compare withdrawal frequencies and scenarios before committing to an actual SWP. It quantifies monthly/quarterly/yearly income, projects how the corpus evolves, and highlights the impact of different assumed returns or withdrawal rates, allowing you to test conservative and aggressive plans. This is especially useful for retirement planning because it shows whether your corpus can support the withdrawals and how long it may last under chosen assumptions.
How is a monthly SWP different from quarterly, half-yearly or yearly SWP?
A monthly SWP gives the most regular cash flow and is best for everyday expenses, while quarterly, half-yearly and yearly SWPs provide progressively larger but less frequent payments and usually allow the corpus to grow more between withdrawals. The comparison table shows monthly SWP as 'highest' cash flow regularity and lowest investment growth potential, while yearly SWP offers the 'highest' growth potential but 'lowest' regularity; examples include ₹10,000/month, ₹30,000/quarter, ₹60,000/6 months, and ₹1,20,000/year. Choose frequency based on your cash needs, discipline, and preference for potential growth vs regular income.
Should I choose SWP, SCSS or FD for retirement income?
The choice depends on your risk appetite and priorities: SWP (mutual funds) is market-linked with variable returns and inflation protection but no capital guarantee, SCSS (Senior Citizen Savings Scheme) is government-backed with fixed returns and high safety, and Fixed Deposits (FDs) offer fixed returns with moderate liquidity. The comparison table lists SWP as suitable for wealth plus flexible income, SCSS for very safe retirement income (eligible for 60+ and has 5-year lock-in), and FDs for stable fixed income with penalties for early withdrawal. If you prioritise capital safety and fixed payouts choose SCSS/FD; if you want inflation-beating returns and flexibility, SWP may be preferable.
What is a safe SWP withdrawal rate in India?
Safe SWP withdrawal rates vary by risk tolerance: a 3% withdrawal has very high sustainability and very low risk, 4% is considered high sustainability with low risk, 5–6% is moderate sustainability with moderate risk, and 7% or higher carries low sustainability and high risk. The provided withdrawal-rate table categorises 3% as 'very high' sustainability and 8%+ as 'very low' sustainability, so many advisers use 3–4% as a conservative rule while more aggressive plans may target 5–6%. Your sustainable rate depends on portfolio returns, time horizon, and how much downside risk you can tolerate.
What are the 4% and 7% SWP withdrawal rules?
The 4% rule suggests withdrawing 4% of your initial retirement corpus in the first year and adjusting for inflation thereafter as a conservative sustainability guideline, while the 7% rule is a more aggressive approach that allows higher initial withdrawals but carries a higher risk of depleting the corpus. The page highlights 4% as 'high' sustainability and low risk, suitable for long retirement horizons, whereas 7% is labelled 'low' sustainability and high risk, meaning the corpus is likelier to run out in adverse markets. Use 4% for capital preservation and 7% only if you accept higher probability of depletion or have other guaranteed income sources.
How is SWP income taxed in India (Taxation for 2026)?
SWP withdrawals themselves are redemptions from mutual funds and are taxed as capital gains according to the underlying fund type and holding period: equity and equity-oriented funds have STCG taxed at 20% (plus surcharge and cess) if held ≤12 months, and LTCG taxed at 12.5% on gains above ₹1.25 lakh per year (plus surcharge and cess) if held >12 months. Therefore SWP payments from equity funds may be largely LTCG-taxed if the units sold have been held over a year; other fund categories follow their respective tax rules. When planning SWP, factor in these capital gains rules because taxes reduce the effective cash you receive and affect the long-term sustainability of withdrawals.
How should senior citizens approach SWPs?
Senior citizens often consider SWPs because they provide flexible, periodic income from mutual funds while potentially offering higher post-tax returns than fixed-income products, but they must balance income needs with capital safety and tax implications. The page notes seniors prefer reliable income; however, unlike SCSS or FDs, SWPs are market-linked and not capital guaranteed, so combining SWP with safe instruments (like SCSS) can diversify risk. Seniors should choose conservative withdrawal rates (e.g., 3–4%) or lower equity exposure, and consult tax rules since LTCG/STCG treatment influences net income.
Need help staying Calculators compliant?
MoneyGence's AI Finance OS tracks your compliance, wallet share, and finances in one place, built for agencies and growing businesses.
Get started with MoneyGence